In our 40-person sample of people checked as having no LinkedIn profile, Exa and Parallel still returned a LinkedIn profile on all 80 searches.[1]
A search engine retrieves plausible pages. It doesn't know whether a person exists or whether a same-name stranger is the person you asked for, so the agent needs its own way to say “no”.
Here is what we learned building and measuring that agent from March through November: outcome choices, search, identity matching, ranking, graders and model choice. Each number comes from its own task and sample, so read each result on its own terms.
Paul Graham wrote about spam filters: “The problem with a ‘score’ is that no one knows what it means.”[2] Agent evals have the same problem. A single “accuracy” number covers a correct profile, a confident stranger and an answer the system declined to make, and those are three different product outcomes. We score them separately.
What did the safety check buy?
Before suggesting who to meet at an event, Meshi's agent looks up a person's profile. A wrong profile can make a polished brief describe the wrong human. A review prompt costs a click, and a no-match tells the user we couldn't find the person. Each outcome has a different cost.
We compared the same discovery output twice: once with the profile corroboration check off, once on. Both arms used the same search results and LLM-judge outputs; only the check changed. It requires the person's surname and employer to appear in the selected candidate's own profile. If either is missing, the candidate goes to review.[3]
On 200 people whose LinkedIn profiles were known, the judge returned 137 matches (68.5%) by our exact-or-plausible-username-variant test, sent 41 (20.5%) to review, returned no match for 21 (10.5%) and selected one profile under a renamed URL (same numeric profile ID). With the check on, it returned 133 matches (66.5%) by the same test, sent 45 (22.5%) to review, returned no match for 21 and selected the same renamed-URL profile.[4]
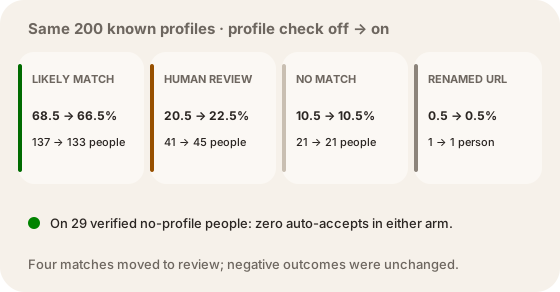
The check moved four matches to review. All four were exact-username matches to the expected profile, so these were correct matches held back, not prevented errors. One further selection, the same in both arms, used a renamed URL for the same numeric profile ID. On the 29 people with no profile, each arm returned 28 no-matches and one review, with zero auto-accepts.
So the check added four review outcomes per 200 known-profile lookups, about one in 50, and no wrong-profile selection was observed in either arm. Scoring outcomes separately makes that trade visible: a blended accuracy number could read fewer auto-attached answers as a safety win.
Why does search need a “no result” test?
We compared five LinkedIn search routes on 200 people with known profiles. Using name and current employer, Exa ranked the right profile first 91.5% of the time; Google through Apify, 90.0%; Google through RapidAPI, 89.5%; Parallel, 77.0%; Tavily, 39.0%.[5]
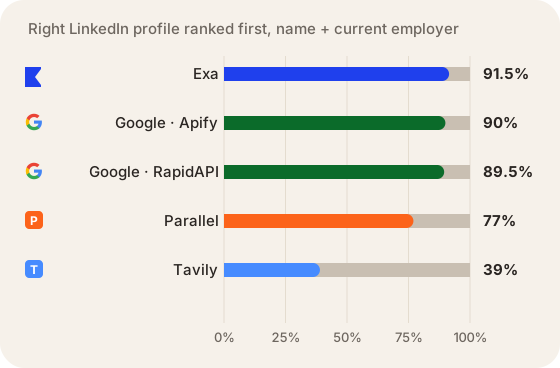
The top three were within two percentage points of each other. Those results answer one question: when the right profile exists, how often does it come first? The no-profile case needs its own test.
For that, we used 40 people whose lack of a LinkedIn profile had been checked, and ran two queries per person per engine (80 per engine). Exa and Parallel ranked a LinkedIn profile first in all 80 attempts; Google via Apify and RapidAPI did so on 55 of 80 (68.8%) each; Tavily on 50 (62.5%).[1]
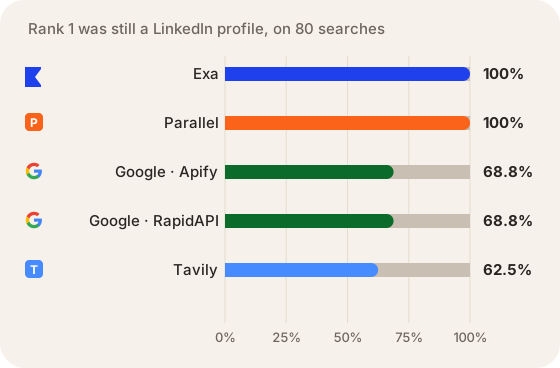
Some search engines always return a candidate, so “not found” has to come from the next step. Our pipeline treats search results as candidates, and a judge can accept, abstain or request review. Search finds the candidate, and the judge confirms the person in the query owns that profile.
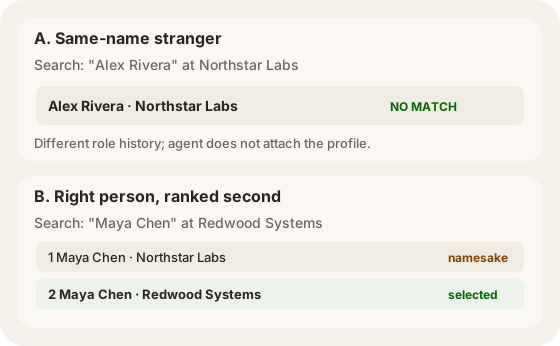
The two examples are two eval cases: abstain when the only candidate is a same-name stranger, and pick the right profile when it ranks second behind one. A test set of easy top-ranked positives checks neither skill.
What did identity matching teach us about labels?
The next step is to decide which candidate is the right person. In October, we tested a 150-million-parameter model in front of Gemini on saved data. Ettin-150M accepted confident cases; Gemini judged the rest. On two development sets of 5,934 and 5,930 people, the cascade matched 118 and 97 more people than Gemini alone, at 59–65% less Gemini spend, and lost none of the matches Gemini made. Labels came from identities we already had on record.[6]
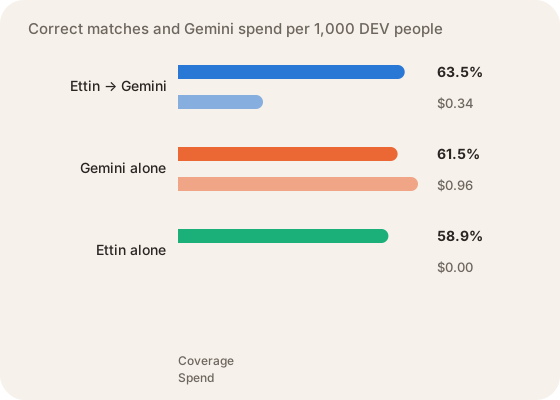
On the second set, we audited the labels by pairing 30 apparent errors with 30 decoys. Two AI reviewers and a resolver supported the model's choice in 26 cases, left four unknown and contradicted none. An earlier audit on the first set, under a stricter proof-of-account rubric, left every case unknown, so these labels measure agreement with our records. We haven't run the final held-back test.[6]
So the supported claim is coverage: against labels derived from existing identities, the cascade matched more people and made fewer Gemini calls. When a model's error rate plateaus, audit the labels before scaling the model, because some of the remaining errors may be label errors.
Can an LLM improve the order people see?
At a 366-person event, our existing order put grader-rated good matches in 49 of 90 top-ten slots across nine goals. Gemini reranking the whole list put 88 of 90 there, at a median of 9.5 seconds per search.[7]
A small model followed by Gemini 3.5 Flash-Lite on the top 15 kept 78/90 slots for about $1.25 per 1,000 searches, 36 ms over our latency limit. A later test of dozens more orderings found none that beat this two-step setup at nine goals (all p ≥ 0.22).[7]
Latency, cost and label quality belong beside top-ten results.
Who grades the graders?
Two panels of three LLM graders labeled the same 520 candidate-goal pairs good or poor. They agreed on 56.3%; chance agreement from their base rates was 44.5% (kappa 0.21). One panel called 42% good; the other, 83%.[8]
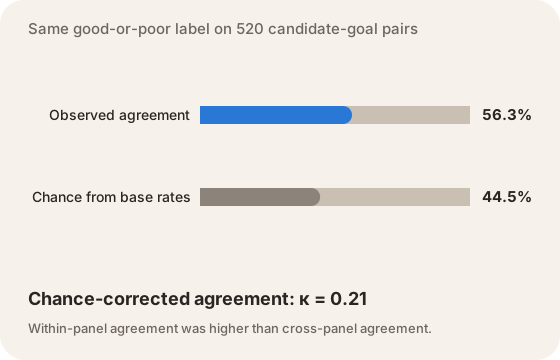
Each panel was consistent inside itself, and that didn't predict agreement with the other. Run a second panel and planted controls before reporting a grader-based win.
How should we choose a model?
The model work changed as the product changed. The best model for Meshi depended on the task, prompt, tools, route and grader.
In March we built a first scorecard on seven synthetic-embedding fixtures. Rank correlation was 98%, bilateral match score 51% and precision@3 52%. The 98% mostly showed that the ranking reproduced its own ordering, so bilateral fit and the quality of the top three became the numbers to improve. Before comparing models, we chose which outcome the product needed.[9]
In May we ran a 12-model goal-generation bench on three real-user fixtures. Cerebras GPT-OSS-120B passed validation on all three in 3.8 seconds on average. In an earlier run, Gemini Flash variants took 12–17 seconds, and DeepSeek Flash averaged 57 seconds, past the 15-second timeout. With three fixtures this is a routing result for one task, and it shows that an answer that parses and arrives inside the product's timeout can beat one that does neither.[10]
In June, a four-entity head-to-head put Gemini 3.1 Flash-Lite at 11.9 times faster per extraction call (median) and 3.2 times cheaper per person than MiniMax M2.7. Both grounded 100% of traits in source chunks. Gemini returned 56.5 traits per person against MiniMax's 88.25, with the gap mostly in skill and values traits. Grounding shows a trait is supported, and a trait-count gap needs a usefulness judge to read, so we kept our default model.[11]
In September, a live router gave us a sharper latency picture than our first test. Two OpenRouter calls had made GPT-6 Astra and Gemini 3.8 Flash look similar. On the live router, one 5,417-token Astra request through Azure took 2.434 seconds, against a Gemini 3.8 Flash average of 4.617 seconds across 116 recent production rounds. That pointed to Astra being faster, and it updated our earlier view that model choice was not the lever. The comparison is one Astra request against a production average, not a randomized head-to-head.[12]
Wider traces showed where the rest of the wait goes. In a staging trace, compile took about three seconds and the Astra provider call about half a second, with inter-step gaps adding more. A separate 30-day production sample of 75 inbound SMS (67 replied) averaged 47 seconds from message to first reply, and model inference was one part of that. These come from different windows. They point to measuring the whole user-visible turn.[13]
For GPT-6.1 Sol we compared speed tiers directly. In 22 paired fixture turns at production-size prompt lengths, Fast reduced median round time from 2.16 to 1.67 seconds; Ultrafast reached 1.33 seconds. We later chose Fast for production; this fixture measures model rounds, not end-to-end production savings. Per-round costs were $0.0105 for Standard, $0.0211 for Fast and $0.0633 for Ultrafast. All three arms passed the fixture's AI-graded checks, 22 of 22; 22 turns are too few to separate quality. A two-round projection puts the saving at about one second for Fast ($0.075 extra) and about 1.7 seconds for Ultrafast ($0.373 extra) per SMS. The turn metric excludes compile, queue, database and delivery time, so these are fixture estimates, not observed production savings.[14]
In October we tested Qwen 3.7 Flash against Gemini on five inference tasks over 36 profiles and 648 blind judgments. Qwen cleared the four-times-cheaper target on every task, reaching 24.7 times cheaper on benefit, with savings measured on the repaired/fallback delivery chain. Blinded judged quality was 10.6% lower overall, beyond our pre-set ~5% bar, with the largest losses on shape (15.8%) and benefit (12.1%) and on the non-obvious-deduction and calibration axes. Trait-skill stayed within the bar, which was not enough on its own to make the whole model a fit.[15]
A later 36-profile screen separated tasks. Luna standard beat the Gemini baseline by 18.5% on traits, 27.7% on goals and 6.4% on benefit. DeepSeek Flash-1017 cleared cost and quality bars for needs/offers. Luna Batch projected 5.7–18.8× lower costs for traits/goals/benefit; full-profile batch cost and batch quality were not measured, and the shape task was below the quality bar. In a separate eight-profile synthetic screen, Mercury 3 did not reach the price-quality frontier. A different brief study preferred Ling 3.1 Flash to the incumbent on 43 of 60 enriched pairs (five ties); preference is a different measure from factuality, and the unsupported-claim flags are grader judgments. These screens use different tasks, prompts, data and judges, so each stands alone.[15][16]
In November we benchmarked Gemini 4 in the same runtime our agent uses in production, with the same prompt compiler, XML tool-call grammar and streaming driver. We compared Hydrogen and Argon, two Gemini 4 variants, across 206 complete paired case-by-time-block units. Hydrogen medium took 0.44 times Argon medium's model time (95% interval 0.41–0.47): median 9.9 seconds instead of 22.4, 95th percentile 29.9 instead of 76.7. Three blind LLM graders rated usefulness −0.03 points lower, with an interval from −0.09 to +0.02, inside the study's ±0.25-point equivalence margin.[17]
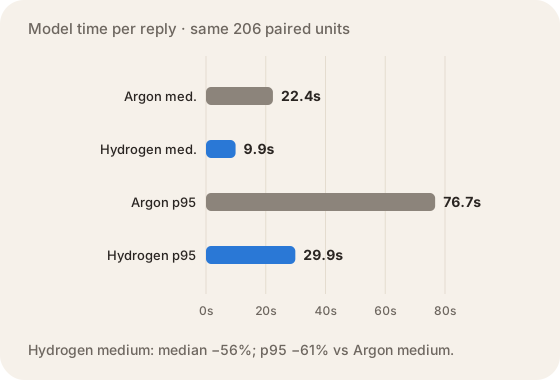
The benchmark recommended Hydrogen medium, and production moved to it while the study ran. Hydrogen low was faster still, and 80 of 542 tool attempts returned a MALFORMED_FUNCTION_CALL error; five of 219 runs still errored after retries. Medium had two such errors in 509 attempts, and both recovered. That result applies to this model, setting and tool grammar.[17]
An earlier test showed the model claiming it had saved a goal when the goal-writing tool was missing. In 45 synthetic goal runs at each Hydrogen level, the real goal-writing tool wrote the requested goal and the model made no false save claims. Test a model with the tools it will have in production.[17]
What would we build on day one?
Five things we would set up before choosing a model:
- Score the right answer, no answer and wrong answer separately, and measure a human handoff if it has a cost.
- Include genuine no-answer cases, and verify the answer is absent. An empty database row doesn't prove no profile exists.
- Pair old and new on the same inputs. Hold search results, tool outputs, prompts and graders fixed when you test one change, so you know what moved the score.
- Plant known-answer and known-failure checks. If the evaluator misses them, fix the measurement before tuning the model.
- Treat abstention and human review as valid outcomes.
Then add the model-specific checks: schema validity, tool-call reliability, timeout, 95th-percentile latency, cost per completed task and grader calibration. Test the whole interaction path. A benchmark that leaves out the compiler, tools, retry policy or queue measures one component of the experience your user gets.
Go deeper
- Which search API actually finds the right person?
- Can a 150M model take load off Gemini?
- Does an LLM rerank beat your search order?
- Can you trust your LLM graders?
Study notes
Footnotes
-
We drew 60 candidate negatives, kept 40 after independent verification and rejected 18 candidates. The September provider benchmark searched that 40-person set twice per engine (80 attempts per provider); counts are in the linked post. A later check confirmed 29 of the 40 have no profile, with 7 unclear and 4 found to have profiles; the 40/80 figures in this article use the full set. These are URL-retrieval results, not independent estimates of real-world wrong-person frequency. Earlier search article. ↩ ↩2
-
Paul Graham, “A Plan for Spam” (2002). He was writing about spam-filter scores; the point here is that the number needs a defined meaning. ↩
-
The paired run covered 200 known-profile positives and 29 independently confirmed no-profile negatives. The same search results and Gemini 3.1 Flash-Lite judge outputs fed both gate conditions; when the live cascade needed a second search hop, the runner used the same candidate outputs for each arm. The comparison isolates the corroboration rule, not search or judge quality. ↩
-
The replay credited exact expected usernames and outputs whose URL slugs matched a heuristic for plausible username variants; this is a retrieval proxy, not independent identity verification. One person's profile slug had changed (same numeric profile ID); the selection under the new slug is not counted as a heuristic match in either arm. The four cases moved to review were exact-username matches to the expected profile, so they were held-back correct matches, not prevented errors. The gate left that renamed-URL selection unchanged. On 29 no-profile people, both conditions had 28 no-matches, one review and zero wrong-profile accepts. Zero observed auto-accepts in 29 cases is not a production error-rate guarantee. ↩
-
The September provider benchmark sampled 200 known profiles and made three query variants per person. The reported rank-one rate is the name-plus-current-employer query, n=200 per provider (not all query calls pooled). The top three were within two percentage points; overlapping intervals and this sample do not establish a stable vendor ranking. ↩
-
The development sets are called DEV (5,934 people) and CAL (5,930) in the linked post. Labels came from identities in Meshi's records and were not checked by a person. DEV coverage was 63.48% for the cascade vs 61.49% for Gemini alone; DEV Gemini spend was $0.34 vs $0.96 per 1,000. CAL added 97 matches. The separate CAL label audit paired 30 apparent errors with 30 decoys; two AI reviewers and a resolver supported 26, left four unknown and contradicted none. An earlier DEV audit under a stricter proof-of-account rubric left all cases unknown. We haven't run the final held-back test, and production still runs Gemini alone. Full study and bounds. ↩ ↩2
-
One 366-person event, nine goals passing planted-control checks, ten top-ten slots per goal. The original Gemini 3.8 Flash arm reached 88/90 at 9.5-second median; the two-step follow-up reached 78/90 and about $1.25 per 1,000 searches, but missed its latency limit by 36 ms. It was an exploratory test and isn't in production. A later same-pool comparison found no later variant beat the two-step rerank under a sign test across nine goals (all p ≥ 0.22). Methods and limitations. ↩ ↩2
-
The same 520 pairs were rated by two panels; the second panel saw fuller profiles and a different candidate pool/snapshot. Cross-panel kappa was recomputed from the agreement grid, with 95% interval 0.16–0.27. All labels came from LLMs on one event; this measures disagreement between these panels, not a universal grader error rate. Grader study. ↩
-
March 2026 matching baseline: seven fixtures with synthetic embeddings; rank correlation 98%, bilateral score 51%, precision@3 52%. These metrics answer different questions, and we treat precision@3 as noisy. This baseline is not a model comparison. ↩
-
May 2026 goal generation: 12-model run, three real-user fixtures, schema/validation pass rate and latency drove the immediate choice. GPT-OSS-120B passed 3/3 at a 3.8-second average; other model samples were too small for a broad quality claim. The Gemini Flash timing comes from an earlier run, not the 12-model table. A model can also fail the 15-second timeout or return malformed JSON, independently of its semantic quality. ↩
-
June 2026 head-to-head on the same four entities: Gemini 3.1 Flash-Lite vs MiniMax M2.7. Both grounded all traits in source chunks; Gemini returned 56.5/person vs MiniMax's 88.25. The 11.9× figure is the median latency per extraction call; the 3.2× figure is cost per person. The earlier 10-entity run was incomplete. No distinctiveness judge ran, so trait counts alone don't show quality; we kept the default model. ↩
-
In September, a first test compared two streamed calls per model through OpenRouter at ~26k tokens; Astra looked latency-neutral against a 14-day Gemini production mean. A second test used one 5,417-token live-router Astra request (Azure binding with reasoning on: 2,434 ms; reasoning off: 1,636 ms; OpenAI Fast: 1,125 ms) against Gemini 3.8 Flash production mean 4,617 ms across 116 rounds. This revised the earlier conclusion, but the request size, arm count and estimator differ; it was not randomized or same-input. ↩
-
The 30-day production sample of 75 inbound SMS (67 replied) averaged 47.47 seconds from message to first reply (p50 28.53 s); about 13 seconds per turn fell between instrumented steps. Separate staging traces measured multi-second compile work and inter-step gaps. These measurements diagnose where time may go; they do not establish that every later request has the same latency profile. ↩
-
GPT-6.1 Sol tier comparison, October: 22 paired fixture turns from 11 synthetic fixtures run twice, 34 rounds per arm, about 22,285 median input tokens, mostly cache reads. Round p50: Standard 2.16 s, Fast 1.67 s, Ultrafast 1.33 s; per-round cost $0.0105, $0.0211, $0.0633. All 22 turns per arm passed the AI-graded rubric, but the sample was not powered to distinguish quality. The turn metric excluded compile, queue, database and delivery. These are not end-to-end production latency estimates. ↩
-
October screen: 36 real profiles, 324 packets, 648 blind judgments; Qwen cost 4.84–24.66× less on the delivered chain, but scored 10.6% lower overall, beyond the ~5% bar. Trait-skill was within bar. A separate October screen tested Mercury 3 on eight synthetic profiles; rubric scores were normalized to 0–100, not accuracy. No Mercury setting was on the observed price-quality frontier; this small screen is not a statistical-superiority claim. Luna Batch figures belong to a different 36-profile screen: token-based projected costs, standard-output quality only, no measured batch quality; Luna shape missed the quality bar. Do not pool these studies. ↩ ↩2
-
The October brief comparison used 60 deliberately enriched pairs, five ties, one LLM judge/pair. Ling won 43 preferences to the incumbent's 12. Graders flagged unsupported claims on 36 Ling briefs vs 38 incumbent briefs (64 vs 104 total flags); these are judgments, not independently adjudicated truth. Preference is not truth; later prompt studies used different inputs and must not be pooled. ↩
-
The November Gemini 4 study used the production main-text runtime and tool grammar with a synthetic event/member fixture; 19 cases across 11.5 time-spread blocks produced 206 complete paired case-block units. The latency interval is cluster-bootstrap; usefulness was −0.03 points (95% interval −0.09 to +0.02) against a ±0.25 equivalence margin. The three graders were Claude models; there was no human grading. People-search results were a deterministic lexical stand-in, and model time excludes compile, queue, tools and channel delivery. Hydrogen low had 80/542 malformed-function-call attempts (14.8%, 95% interval 12.0–18.0%) and 5/219 runs failing after retries. At medium, 2/509 attempts ended that way; both recovered. The goal-tool result is 45 runs per Hydrogen level in the synthetic production-tool condition, not proof of zero risk in traffic. ↩ ↩2 ↩3